> Causal inference · Synthetic control
Did the UK's 2008 Climate Change Act actually work?
I used synthetic control methods — a quasi-experimental technique from Abadie et al. — to test whether the UK's flagship climate law actually caused emissions to fall, rather than just coinciding with a downward trend. The method found a clear, statistically robust effect on transport emissions but no detectable effect on total CO₂. The gap between those two results is the interesting part.
01 Why synthetic control
The hard part of measuring a policy is that you only ever see one timeline: the UK passed the law, and emissions did something afterward. You can't observe the UK that didn't pass it. Synthetic control builds that missing comparison. When you have a single treated unit and no obvious match, you construct a weighted blend of untreated units — here, other European countries — that tracks the treated unit's pre-policy trajectory as closely as possible. After the policy, you compare what actually happened to what that synthetic version did.
Three things make it rigorous. It precludes extrapolation — the synthetic UK is only ever a weighted average of real countries, so it can't drift somewhere no real economy has been. It removes researcher bias, because an algorithm picks the weights to fit the pre-policy data, not me. And it's transparent: you can read off exactly which countries make up the synthetic UK and at what weight. For the transport model, the synthetic UK is built mostly from Germany (0.55), Italy (0.5), Finland (0.329), France (0.061), Poland (0.06), and the Netherlands (0.001).
02 What I found
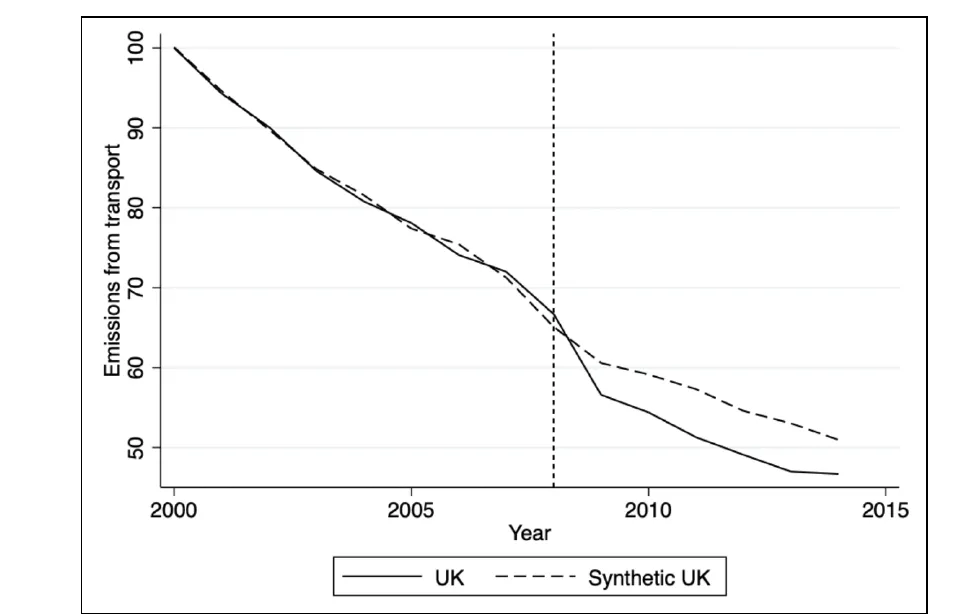
Transport emissions: a clear effect
Shortly after 2008, the real UK opens up a sustained gap of roughly four index points below its synthetic counterfactual, and it holds. This is mechanistically plausible: transport pollutants have short atmospheric lifetimes, so policy shows up fast; the Low Carbon Transition Plan targeted transport directly; and the outcomes are comparatively easy to quantify. When the story and the numbers agree, I trust the result more.
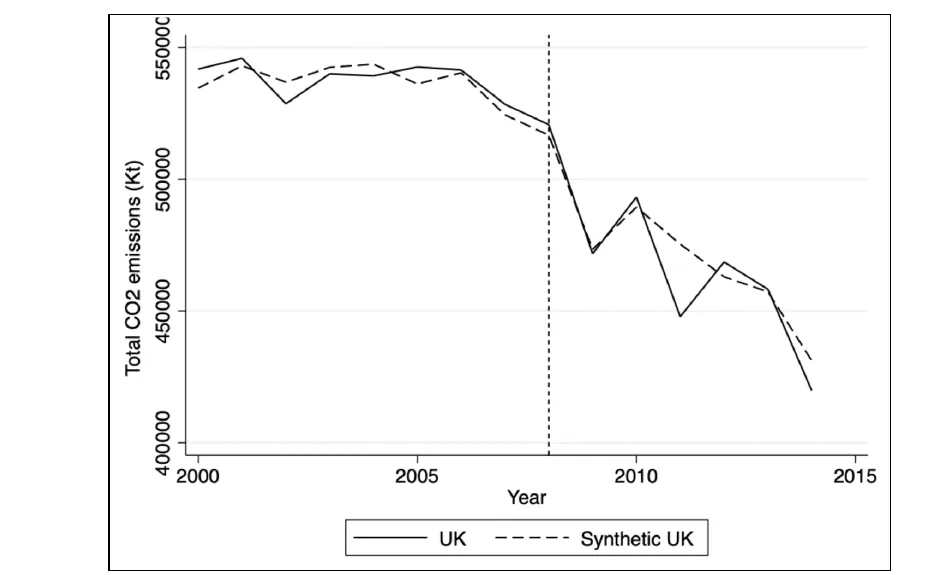
Total CO₂: no detectable effect
The CO₂ model fits well before 2008, then shows no clean separation afterward. I read this as a limit of the method here, not proof the policy did nothing. The independence and no-spillover assumptions are weaker for CO₂: every developed country was tackling it at once, so the "untreated" donor pool wasn't really untreated. And CO₂ is a global stock pollutant with a far longer atmospheric residence time than transport pollutants, so a single country's policy is harder to isolate against a moving global backdrop.
03 How I validated the result
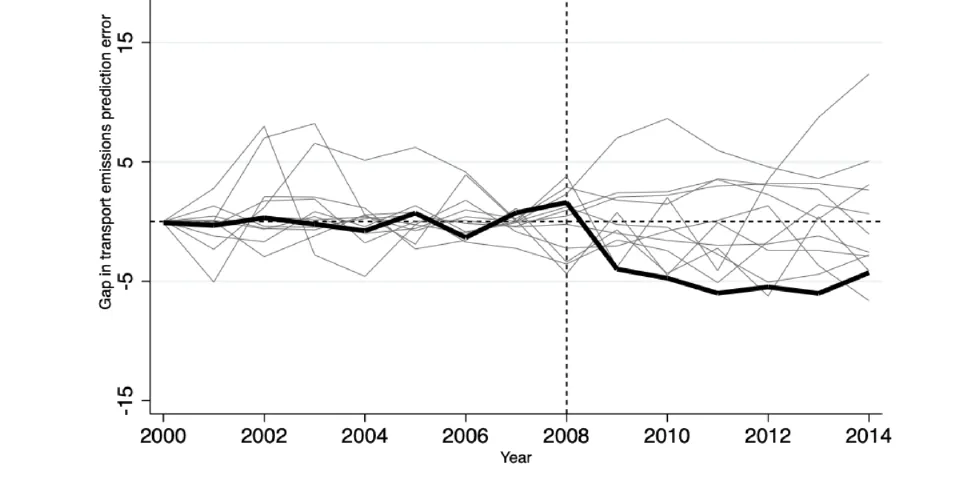
Three robustness tests make the transport finding credible — this is the bar for "I trust this" in causal inference:
- In-space placebo. I re-ran the model pretending every other country had passed the policy. If the UK's drop were just noise, it would sit in the middle of that pack. It doesn't — the UK is the clearest outlier in the distribution.
- In-time placebo. I re-ran with a fake treatment date before 2008. No effect appears until the real date — so the result isn't an artifact of a pre-existing trend.
- Leave-one-out. I dropped each donor country in turn and re-estimated. The effect holds across every permutation, so it isn't propped up by a single country.
04 What I'd do differently now
The donor pool is mostly EU countries, which weakens the independence assumption — they were all subject to overlapping EU-level climate policy, so they aren't a clean "untreated" comparison. I'd re-run with a non-EU European donor pool (Norway, Switzerland, Iceland) as a sensitivity check.
The post-treatment window also includes the 2008–2009 financial crisis, which hit UK transport demand asymmetrically and could be doing some of the work I'm attributing to policy. A longer window with explicit recession controls would make the transport result harder to argue with.
Finally, the z-test I reported (Table 5 in the original paper) is out of place — the placebo distributions are the real significance test in this framework. I'd cut it.